Category Archives: PostgreSQL

“Row Movement” in PostgreSQL… Is it bad?

In Oracle, right or wrong, I was always taught to try to avoid “row movement” between partitions due to the general thought that the extra workload of a “delete” + “insert” (rewrite of the row) should be avoided due to the extra I/O, index fragmentation and the associated risks of a migrating ROWID in the cases where the app developers might have used it in their code (now that’s a whole other problem). Oracle didn’t even let you do it by default.

Table by table, you had to explicitly set:

alter table [table name] enable row movement;

Now, you also had to set this to do table reorganizations such as “alter table…. shrink space / shrink space compact” so it wasn’t something unheard of. However, when a customer recently explained to me that they were going to partition a PostgreSQL table and update the partition key column from null to the date when the row got processed, my mind immediately went to the space of that’s probably bad……. RIGHT??

Well, once I thought about it, maybe it’s not all that bad due to the way MVCC and the subsequent VACUUM operations occur in PostgreSQL. The only thing I could think of that might be a factor is that you would lose any potential benefit of HOT (Heap-Only-Tuple) updates since the row will no longer be part of the original partition, seeing that partitions in PostgreSQL are just another table. The benefit though is that I could limit my vacuum operations to one single partition and SMALLER table. A plus for this customer.

**** Note: An implementation like this does not necessarily follow best practices with regards to partitioning. That being said, I was attempting to validate the idea with regards to how PostgreSQL MVCC behaves.

That being said, I wanted to at least be able to prove / disprove my thoughts with a demonstration, so off to PostgreSQL we go. First let’s create a simple partitioned table and use pg_partman to help:

CREATE TABLE partman_test.partman_partitioned (
	id integer not null, 
	val varchar(20) not null,
	created_tmstp timestamp not null,
	event_tmstp timestamp null) 
PARTITION BY RANGE (event_tmstp);

CREATE INDEX partman_partitioned_ix1 ON partman_test.partman_partitioned (id);

SELECT partman.create_parent( p_parent_table => 'partman_test.partman_partitioned',
 p_control => 'event_tmstp',
 p_type => 'native',
 p_interval=> 'daily',
 p_premake => 3);

Now, lets insert some random data using a date randomizer function to spread the data across new partitions:

CREATE OR REPLACE FUNCTION partman_test.random_date(out random_date_entry timestamp) AS $$
select current_timestamp(3) + random() * interval '2 days'
$$ LANGUAGE SQL;

INSERT INTO partman_test.partman_partitioned VALUES ( 
		generate_series(0,10000), 
		substr(md5(random()::text), 0,10),
		partman_test.random_date(),
		NULL);

And then for demonstration purposes, I will set autovacuum to “off” for all the partitions” and run 100 updates to move the data into random partitions using the following statement:

ALTER TABLE partman_test.partman_partitioned_default SET (autovacuum_enabled = false);
ALTER TABLE partman_test.partman_partitioned_p2023_09_05 SET (autovacuum_enabled = false);
ALTER TABLE partman_test.partman_partitioned_p2023_09_06 SET (autovacuum_enabled = false);
ALTER TABLE partman_test.partman_partitioned_p2023_09_07 SET (autovacuum_enabled = false);

do $$
declare
  v_id integer;
begin
	for cnt in 1..100 loop
	  select id 
	  FROM partman_test.partman_partitioned 
	  WHERE event_tmstp is null 
	  LIMIT 1 FOR UPDATE SKIP LOCKED
	  INTO v_id;
	  UPDATE partman_test.partman_partitioned
	    SET event_tmstp = partman_test.random_date()
	    WHERE id = v_id and event_tmstp is null;
	  commit;
	end loop;
end; $$;

Once the updates finish, let’s look at the vacuum stats:

relname                                     |autovac_enabled|live_tup|dead_dup|hot_upd|mod_since_stats|ins_since_vac|
--------------------------------------------+---------------+--------+--------+-------+---------------+-------------+
partman_test.partman_partitioned            |true           |       0|       0|      0|              0|            0|
partman_test.partman_partitioned_default    |false          |       0|     100|      0|            100|            0|
partman_test.partman_partitioned_p2023_09_05|false          |      10|       0|      0|             10|           10|
partman_test.partman_partitioned_p2023_09_06|false          |      52|       0|      0|             52|           52|
partman_test.partman_partitioned_p2023_09_07|false          |      38|       0|      0|             38|           38|

Extension “pg_stattuple” confirms that dead tuples only exist in the “default” partition. The reason as to why the numbers don’t match pg_stat_all_tables is a discussion for another day:

table_len|tuple_count|tuple_len|tuple_percent|dead_tuple_count|dead_tuple_len|dead_tuple_percent|free_space|free_percent|
---------+-----------+---------+-------------+----------------+--------------+------------------+----------+------------+
   524288|       9901|   475248|        90.65|              82|          3936|              0.75|      3308|        0.63|
     8192|         10|      560|         6.84|               0|             0|               0.0|      7564|       92.33|
     8192|         52|     2912|        35.55|               0|             0|               0.0|      5044|       61.57|
     8192|         38|     2128|        25.98|               0|             0|               0.0|      5884|       71.83|

So, we definitely proved that we didn’t get the benefit of HOT updates, but due to the MVCC model of PostgreSQL, the update becomes just like any other non-HOT update. This is due to the fact that the updated row is behaving as if it had an index on the row (primary cause of a non-HOT update and sometimes common) and the rest of the MVCC model is just behaving as it would anyway. I did want to validate with one more tool, but unfortunately the extension, “pg_walinspect” was not installed on this CloudSQL for Postgres instance so I was unable to use it.

What about locks? We do get additional locks to manage because we are effecting two partitions instead of one (but they are all fastpath locks):

(postgres@10.3.0.31:5432) [tpcc] > select locktype, database, relation::regclass, page, tuple, pid, mode,granted,fastpath, waitstart from pg_locks;
   locktype    | database |              relation              | page | tuple |  pid   |       mode       | granted | fastpath | waitstart
---------------+----------+------------------------------------+------+-------+--------+------------------+---------+----------+-----------
 relation      |    69323 | partman_partitioned_p2023_09_05    | NULL |  NULL | 129825 | RowExclusiveLock | t       | t        | NULL
 relation      |    69323 | partman_partitioned_default_id_idx | NULL |  NULL | 129825 | RowExclusiveLock | t       | t        | NULL
 relation      |    69323 | partman_partitioned_default        | NULL |  NULL | 129825 | RowExclusiveLock | t       | t        | NULL
 relation      |    69323 | partman_partitioned                | NULL |  NULL | 129825 | RowExclusiveLock | t       | t        | NULL

If we were to have no row movement between partitions there is a slightly lesser amount of locks to manage:

(postgres@10.3.0.31:5432) [tpcc] > select locktype, database, relation::regclass, page, tuple, pid, mode,granted,fastpath, waitstart from pg_locks;
   locktype    | database |                relation                | page | tuple |  pid   |       mode       | granted | fastpath | waitstart
---------------+----------+----------------------------------------+------+-------+--------+------------------+---------+----------+-----------
 relation      |    69323 | partman_partitioned_p2023_09_05_id_idx | NULL |  NULL | 129825 | RowExclusiveLock | t       | t        | NULL
 relation      |    69323 | partman_partitioned_p2023_09_05        | NULL |  NULL | 129825 | RowExclusiveLock | t       | t        | NULL
 relation      |    69323 | partman_partitioned                    | NULL |  NULL | 129825 | RowExclusiveLock | t       | t        | NULL

Also, be aware that you may need to pay special attention to the vacuum operations and settings of the default partition as this type of operation may cause some significant bloat over time. However, one positive is that the bloat will be contained to one and only one partition.

One last caveat that comes to mind. Be sure that either you specify the partition key or explicitly update the “default” partition in your query because otherwise you would get a multiple partition scan which could cause other performance and locking issues.

Enjoy!

Using the “hint_plan” Table Provided by the PostgreSQL Extension “pg_hint_plan”

Introduction

For those who have worked with Oracle, the pg_hint_plan extension is one that will allow you to hint plans in patterns that you are likely very familiar with:

  • sql_patch
  • sql_profile
  • sql_plan_baselines

While currently, the functionality provided by pg_hint_plan is not nearly as robust (hints list), it does provide most of what you would encounter day to day as a DBA. That being said, one thing that is currently missing is the ability to easily add hints without changing code via stored_procedures / functions like in Oracle. The only way to currently do this in Open Source PostgreSQL is to manually manipulate a table named “hints” typically located in the “hint_plan” schema.

The “hints” table which is provided by the extension is highly dependent (just like Oracle) on a normalized SQL statement. A normalized SQL statement in PostgreSQL is one that has all carriage returns removed, all spaces converted to single spaces and all literals and parameters replaced with a “?”. Typically you have to do this manually, but in this blog post, I am going to show how I have leveraged entries in “pg_stat_statements” along with custom written functions to normalize the statement and place it into the “hints” table. To use this “hints” table feature, the following setting must be enabled at either the session or system level:

set session pg_hint_plan.enable_hint_table to on;
or

in the postgresql.conf:
pg_hint_plan.enable_hint_table to on;

What Does a Normalized Statement Look Like?

Typically, when you receive code from a developer or even code that you work on yourself, you format it in order to to make it human readable and easier to interpret. For example, you might want your statement to look like this (notice the parameters / literals in the statement:

SELECT
    b.bid,
    sum(abalance)
FROM
    pgbench_branches b
    JOIN pgbench_accounts a ON (b.bid = a.bid)
WHERE
    b.bid = 12345
    AND a.aid BETWEEN 100 AND 200
GROUP BY
    b.bid
ORDER BY
    1;

Now to normalize the statement for use with the “hints” table it needs to look like this:

select b.bid, sum(abalance) from pgbench_branches b join pgbench_accounts a on (b.bid = a.bid) where b.bid = ? and a.aid between ? and ? group by b.bid order by 1;

You can either manually manipulate the statement to get it in this format do this or we can attempt to do it programmatically. I prefer as much as possible to let the system format it for me so I have written a few helper scripts to do this:

Helper Queries:

**** Feel free to utilize these functions, however they may contain errors or may not normalize all statements. They depend on the pg_stat_statements table and if the entire statement will not fit within the query field of that table, then these functions will not produce the correct output. I will also place them on my public github. If you find any errors or omissions, please let me know. ****

hint_plan.display_candidate_pg_hint_plan_queries

While you can easily select from the “hints” table on your own, this query will show what a normalized statement will look like before loading it to the table. You can leave the “p_query_id” parameter null to return all queries present in the pg_stat_statements in a normalized form or you can populate it with a valid “query_id” and it will return a single normalized statement:

CREATE OR REPLACE FUNCTION hint_plan.display_candidate_pg_hint_plan_queries(
  p_query_id bigint default null
  )
  RETURNS TABLE(queryid bigint, norm_query_string text)
  LANGUAGE 'plpgsql'
  COST 100
  VOLATILE PARALLEL UNSAFE
AS $BODY$
 DECLARE 
 	pg_stat_statements_exists boolean := false;
 BEGIN
   SELECT EXISTS (
    SELECT FROM 
        information_schema.tables 
    WHERE 
        table_schema LIKE 'public' AND 
        table_type LIKE 'VIEW' AND
        table_name = 'pg_stat_statements'
    ) INTO pg_stat_statements_exists;
   IF pg_stat_statements_exists AND p_query_id is not null THEN
    RETURN QUERY
    SELECT pss.queryid,
           substr(regexp_replace(
             regexp_replace(
                regexp_replace(
                   regexp_replace(
                      regexp_replace(pss.query, '\$\d+', '?', 'g'),
                                E'\r', ' ', 'g'),
                              E'\t', ' ', 'g'),
                           E'\n', ' ', 'g'),
                         '\s+', ' ', 'g') || ';',1,100)
 	FROM pg_stat_statements pss where pss.queryid = p_query_id;
   ELSE
    RETURN QUERY
    SELECT pss.queryid,
           substr(regexp_replace(
             regexp_replace(
                regexp_replace(
                   regexp_replace(
                      regexp_replace(pss.query, '\$\d+', '?', 'g'),
                                E'\r', ' ', 'g'),
                              E'\t', ' ', 'g'),
                           E'\n', ' ', 'g'),
                         '\s+', ' ', 'g') || ';',1,100)
 	FROM pg_stat_statements pss;
   END IF;
 END; 
$BODY$;

If our candidate query was this:

select queryid, query from pg_stat_statements where queryid =  -8949523101378282526;
       queryid        |            query
----------------------+-----------------------------
 -8949523101378282526 | select b.bid, sum(abalance)+
                      | from pgbench_branches b    +
                      | join pgbench_accounts a    +
                      | on (b.bid = a.bid)         +
                      | where b.bid = $1           +
                      | group by b.bid             +
                      | order by 1
(1 row)

The display function would return the following normalized query:

SELECT hint_plan.display_candidate_pg_hint_plan_queries(p_query_id => -8949523101378282526);
-[ RECORD 1 ]--------------------------+-------------------------------------------------------------------------------------------------------------------------------------------------------------------
display_candidate_pg_hint_plan_queries | (-8949523101378282526,"select b.bid, sum(abalance) from pgbench_branches b join pgbench_accounts a on (b.bid = a.bid) where b.bid = ? group by b.bid order by 1;")

You can then verify that the query is normalized properly and then move on toward using the next function to add the normalized query to the “hints” table.

hint_plan.add_stored_pg_hint_plan

Using the same query in the previous section, we will now add it to the “hints” table. This is where it is important to understand what hint you want to add.

CREATE OR REPLACE FUNCTION hint_plan.add_stored_pg_hint_plan(
  p_query_id bigint,
  p_hint_text text,
  p_application_name text default ''
  )
  RETURNS varchar
  LANGUAGE 'plpgsql'
  COST 100
  VOLATILE PARALLEL UNSAFE
AS $BODY$
-- p_hint_text can contain one or more hints either separated by a space or
-- a carriage return character.  Examples include:
-- Space Separated: SeqScan(a) Parallel(a 0 hard)
-- ASCII CRLF Separated: SeqScan(a)'||chr(10)||'Parallel(a 0 hard)
-- Single Hint: SeqScan(a)
-- 
-- Escaped text does not work: /* E'SeqScan(a)\nParallel(a 0 hard)'
 DECLARE 
 	hint_id hint_plan.hints.id%TYPE;
 	normalized_query_text hint_plan.hints.norm_query_string%TYPE;
 	pg_stat_statements_exists boolean := false;
 BEGIN
   SELECT EXISTS (
    SELECT FROM 
        information_schema.tables 
    WHERE 
        table_schema LIKE 'public' AND 
        table_type LIKE 'VIEW' AND
        table_name = 'pg_stat_statements'
    ) INTO pg_stat_statements_exists;
   IF NOT pg_stat_statements_exists THEN
    RAISE NOTICE 'pg_stat_statements extension has not been loaded, exiting';
    RETURN 'error';
   ELSE
    SELECT regexp_replace(
             regexp_replace(
                regexp_replace(
                   regexp_replace(
                      regexp_replace(query, '\$\d+', '?', 'g'),
                                E'\r', ' ', 'g'),
                              E'\t', ' ', 'g'),
                           E'\n', ' ', 'g'),
                         '\s+', ' ', 'g') || ';'
 	 INTO normalized_query_text
 	 FROM pg_stat_statements where queryid = p_query_id;
     IF normalized_query_text IS NOT NULL THEN
		INSERT INTO hint_plan.hints(norm_query_string, application_name, hints)
    	VALUES (normalized_query_text,
    			p_application_name,
    			p_hint_text
    	);
    	SELECT id into hint_id
    	FROM hint_plan.hints
    	WHERE norm_query_string = normalized_query_text;
 	    RETURN cast(hint_id as text);
     ELSE
 		RAISE NOTICE 'Query ID %q does not exist in pg_stat_statements', cast(p_query_id as text);
 		RETURN 'error';
     END IF;
   END IF;
 END; 
$BODY$;

Hint text contain one or more hints either separated by a space or a carriage return character. Examples include:

  • Space Separated: SeqScan(a) Parallel(a 0 hard)
  • ASCII CRLF Separated: SeqScan(a)’||chr(10)||’Parallel(a 0 hard)
  • Single Hint: SeqScan(a)
  • Escaped text does not work in the context of this function although this can be used if you are inserting manually to the “hints” table: E’SeqScan(a)\nParallel(a 0 hard)’
SELECT hint_plan.add_stored_pg_hint_plan(p_query_id => -8949523101378282526,
						p_hint_text => 'SeqScan(a) Parallel(a 0 hard)',
						p_application_name => '');

-[ RECORD 1 ]-----------+---
add_stored_pg_hint_plan | 28

Time: 40.889 ms

select * from hint_plan.hints where id = 28;
-[ RECORD 1 ]-----+------------------------------------------------------------------------------------------------------------------------------------------
id                | 28
norm_query_string | select b.bid, sum(abalance) from pgbench_branches b join pgbench_accounts a on (b.bid = a.bid) where b.bid = ? group by b.bid order by 1;
application_name  |
hints             | SeqScan(a) Parallel(a 0 hard)

In the above example, we are forcing a serial sequential scan of the “pgbench_accounts”. We left the “application name” parameter empty so that the hint applies to any calling application.

hint_plan.delete_stored_pg_hint_plan

You could easily just issue a delete against the “hints” table, but in keeping with utilizing a “function” approach to utilizing this functionality, a delete helper has also been developed:

CREATE OR REPLACE FUNCTION hint_plan.delete_stored_pg_hint_plan(
  p_hint_id bigint
  )
  RETURNS TABLE(id integer, norm_query_string text, application_name text, hints text)
  LANGUAGE 'plpgsql'
  COST 100
  VOLATILE PARALLEL UNSAFE
AS $BODY$
 BEGIN
    RETURN QUERY
    DELETE FROM hint_plan.hints h WHERE h.id = p_hint_id RETURNING *;
 END; 
$BODY$;

To delete a plan you can call the procedure as follows:

 SELECT hint_plan.delete_stored_pg_hint_plan(p_hint_id => 28);
-[ RECORD 1 ]--------------+------------------------------------------------------------------------------------------------------------------------------------------------------------------------------------
delete_stored_pg_hint_plan | (28,"select b.bid, sum(abalance) from pgbench_branches b join pgbench_accounts a on (b.bid = a.bid) where b.bid = ? group by b.bid order by 1;","","SeqScan(a) Parallel(a 0 hard)")

Time: 33.685 ms
select * from hint_plan.hints where id = 28;
(0 rows)

Time: 24.868 ms

As you can see the “hints” table is very useful and can help you emulate many parts of SQL Plan Management just like in Oracle.

Enjoy and all feedback is welcomed!!!

Leverage Google Cloud Logging + Monitoring for Custom Cloud SQL for Postgres or AlloyDB Alerts

As migrations to CloudSQL and AlloyDB pick up speed, inevitably you will run into a condition where the cloud tooling has not quite caught up with exposing custom alerts and incidents that you may be exposing on-premises with tools such as Nagios or Oracle Enterprise Manager. One such example is monitoring of replication tools such as the GoldenGate Heartbeat table. While there are many ways that you may be able to implement this, I wanted to demonstrate a way to leverage Google Cloud Logging + Google Cloud Monitoring. Using this method will allow us to keep a long term log of certain parameters like lag or anything else you have built into the heartbeat mechanism. To demonstrate, lets use Python to query the database and create a Cloud Logging Entry:

import argparse
from datetime import datetime, timedelta
from sqlalchemy import create_engine, text
from google.cloud import logging


def retrievePgAlert(
    username: str,
    password: str,
    hostname: str,
    portNumber: int,
    databaseName: str,
    alertType: str,
) -> None:

    alertList: list = []

    conn_string = f"postgresql+psycopg2://{username}:{password}@{hostname}:{portNumber}/{databaseName}?client_encoding=utf8"
    engine = create_engine(conn_string)
    with engine.connect() as con:

        if alertType == "ogg-lag":
            sqlQuery = text(
                f"select replicat, effective_date, lag from ogg.heartbeat where lag >=:lagAmt and effective_date >= now() - interval ':intervalAmt min'"
            )

        result = con.execute(
            sqlQuery, {"lagAmt": oggLagAmt, "intervalAmt": checkIntervalMinutes}
        ).fetchall()
        for row in result:
            alertList.append(row)

        if not alertList:
            print(f"No alerts as of {datetime.now().strftime('%m/%d/%Y %H:%M:%S')}")
        else:
            for alertText in alertList:
                print(
                    f"Replicat: {alertText[0]} at date {alertText[1]} has a total lag of: {alertText[2]} seconds"
                )

            writeGcpCloudLoggingAlert(
                logger_alert_type=alertType,
                loggerName=args.loggerName,
                logger_message=alertList,
            )

    con.close()
    engine.dispose()


def writeGcpCloudLoggingAlert(
    logger_alert_type: str,
    loggerName: str,
    logger_message: list,
) -> None:

    # Writes log entries to the given logger.
    logging_client = logging.Client()

    # This log can be found in the Cloud Logging console under 'Custom Logs'.
    logger = logging_client.logger(loggerName)

    # Struct log. The struct can be any JSON-serializable dictionary.
    if logger_alert_type == "ogg-lag":
        replicatName: str
        effectiveDate: datetime
        lagAmount: str

        for alertFields in logger_message:
            replicatName = alertFields[0]
            effectiveDate = alertFields[1]
            lagAmount = int(alertFields[2])

            logger.log_struct(
                {
                    "alertType": logger_alert_type,
                    "replicat": str(alertFields[0]),
                    "alertDate": alertFields[1].strftime("%m/%d/%Y, %H:%M:%S"),
                    "alertRetrievalDate": datetime.now().strftime("%m/%d/%Y, %H:%M:%S"),
                    "lagInSeconds": int(alertFields[2]),
                },
                severity="ERROR",
            )

    print("Wrote logs to {}.".format(logger.name))


def delete_logger(loggerName):
    """Deletes a logger and all its entries.

    Note that a deletion can take several minutes to take effect.
    """
    logging_client = logging.Client()
    logger = logging_client.logger(loggerName)

    logger.delete()

    print("Deleted all logging entries for {}".format(logger.name))


if __name__ == "__main__":

    cloudSQLHost: str = "127.0.0.1"
    hostname: str
    portNumber: str
    database: str
    username: str
    password: str
    oggLagAmt: int = 15
    checkIntervalMinutes: int = 20

    with open("~/.pgpass", "r") as pgpassfile:
        for line in pgpassfile:
            if line.strip().split(":")[0] == cloudSQLHost:
                hostname, portNumber, database, username, password = line.strip().split(
                    ":"
                )

    parser = argparse.ArgumentParser(
        description=__doc__, formatter_class=argparse.RawDescriptionHelpFormatter
    )
    parser.add_argument(
        "-loggerName",
        "--loggerName",
        type=str,
        help="GCP Cloud Log Namespace",
        default="postgres-alert",
    )
    parser.add_argument(
        "-alertType",
        "--alertType",
        type=str,
        help="Type of alert to log",
        default="ogg-lag",
    )
    args = parser.parse_args()

    if args.alertType == "ogg-lag":
        retrievePgAlert(
            hostname=hostname,
            username=username,
            password=password,
            portNumber=portNumber,
            databaseName=database,
            alertType=args.alertType,
        )

In this script we utilize the Google Cloud Logging APIs, SQLAlchemy and some other basic python imports to query the database based on a lag amount we are looking for from the heartbeat table.

***Note: The query within the python code could check for any condition by changing the query, by leveraging “gcloud” commands or REST API calls.

If the condition is met, the script creates a JSON message which is then written to the appropriate Google Cloud Logging Namespace. An example of the JSON message is below (sensitive information like the project id and instance id have been redacted):

{
  "insertId": "1b6fb35g18b606n",
  "jsonPayload": {
    "alertRetrievalDate": "01/20/2023, 18:47:20",
    "lagInSeconds": 15,
    "alertType": "ogg-lag",
    "alertDate": "01/20/2023, 18:34:55",
    "replicat": "r_hr"
  },
  "resource": {
    "type": "gce_instance",
    "labels": {
      "project_id": "[project id]",
      "instance_id": "****************",
      "zone": "projects/[project id]/zones/us-central1-c"
    }
  },
  "timestamp": "2023-01-20T18:47:20.103058301Z",
  "severity": "ERROR",
  "logName": "projects/[project id]/logs/postgres-alert",
  "receiveTimestamp": "2023-01-20T18:47:20.103058301Z"
}

Create a Cloud Logging Alert

Now that we have published a message to Cloud Logging, what can we do with it? Generally there are two paths, either a Cloud Metric or a Cloud Alert. For this demonstration, we will use the “Cloud Alert”. So to start the setup navigate to the console page “Operations Logging” —> “Logs Explorer”. From there click the “Create alert” function. The following dialog will show. You will need to double check the query to retrieve the appropriate logs in step 2, and in step 3, you can choose the time between notifications (this is to mute alerts that happen in between the interval) and how long past the last alert an incident will stay open. In this case, we will mute duplicate alerts that happen for 5 minutes after the first alert (if an alert occurs at 6 minutes another notification will fire) and incidents will remain open for 30 minutes past the last alert (no new incidents will be logged unless an alert occurs after that time frame). The query to be used within the alert is as follows:


logName="projects/[project id]/logs/postgres-alert"
AND severity="ERROR"
AND (jsonPayload.alertType = "ogg-lag")
AND (jsonPayload.lagInSeconds >= 15)
AND resource.labels.instance_id = [instance id]

The following dialogues outline the screens used to setup the alert.

The last step will be to choose your notification method, which is managed by different notification channels. The different types of notification channels include:

  • Mobile Devices
  • PagerDuty Services
  • PagerDuty Sync
  • Slack
  • Webhooks
  • E-Mail
  • SMS
  • Pub/Sub

Once all of this is defined, your alert is now set to notify once you place the python script on an appropriate schedule such as linux cron, Google Cloud Scheduler, etc. In this case we will now wait for an issue to occur that conforms to the alert. When it does an email like the following will result to the notification channel:

As your migration to cloud continues, keep an open mind and look for alternative ways to handle all of the operational “things” you are accustomed to in your on-premises environment. Most of the time there is a way in cloud to handle it!

Why is My App Table Scanning in PostgreSQL but not Oracle?

My team and I have been working on a lot of migrations off of Oracle and onto Google CloudSQL for Postgres / AlloyDB lately. One of the common things that I have been seeing in my performance tuning / migration activities is that Oracle handles certain application datatypes differently than PostgreSQL. For my most recent client, they used the “float” datatype extensively in their Java code and unfortunately, the PostgreSQL JDBC driver doesn’t convert that datatype like the Oracle JDBC driver does. The result of the datatype mismatch ends up as a full table scan in PostgreSQL whereas in Oracle it was using an index.

*** Note: This client did not use an ORM within their code. While I still need to test it, I am hopeful that this same issue will not manifest itself when using an ORM like SQLAlchemy (Python) or Hibernate (Java).

While in Oracle numbers are usually stored in the numeric datatype, you have many options within PostgreSQL to do the same thing:

  • numeric (x)
  • numeric (x,y)
  • numeric
  • smallint
  • bigint
  • int

Each serve a purpose and should be used with careful analysis. That said, don’t forget about the code! To demonstrate why, I modified a simple Java test harness I usually use to test connectivity / check SSL Encryption functionality during migrations to show what happens if the datatypes are not looked at carefully.

As you can see, in Oracle, the JDBC driver will convert any of the following types to “numeric“, the same query plan is also achieved using index range scans and no table scans. The output is below and Oracle Code is at the bottom of the post:

java -classpath /Users/shaneborden/Documents/java/ojdbc11.jar:/Users/shaneborden/Documents/java OracleJdbcTest
Password: *******
=====  Database info =====
   DatabaseProductName: Oracle
   DatabaseProductVersion: Oracle Database 19c Enterprise Edition Release 19.0.0.0.0 - Production
Version 19.15.0.0.0
   DatabaseMajorVersion: 19
   DatabaseMinorVersion: 0
=====  Driver info =====
   DriverName: Oracle JDBC driver
   DriverVersion: 21.8.0.0.0
   DriverMajorVersion: 21
   DriverMinorVersion: 8
=====  JDBC/DB attributes =====
   Supports getGeneratedKeys(): true
===== Database info =====


===== Query Plan - Cast Int to Numeric =====
   Plan hash value: 423740054

   -----------------------------------------------------------------------------------------------------------
   | Id  | Operation                           | Name                | Rows  | Bytes | Cost (%CPU)| Time     |
   -----------------------------------------------------------------------------------------------------------
   |   0 | SELECT STATEMENT                    |                     |     2 |    28 |     5   (0)| 00:00:01 |
   |   1 |  TABLE ACCESS BY INDEX ROWID BATCHED| DATATYPE_TEST       |     2 |    28 |     5   (0)| 00:00:01 |
   |*  2 |   INDEX RANGE SCAN                  | DATATYPE_NUMBER_VAL |     2 |       |     3   (0)| 00:00:01 |
   -----------------------------------------------------------------------------------------------------------

   Predicate Information (identified by operation id):
   ---------------------------------------------------

      2 - access("NUMBER_VAL"=:1)


===== Query Plan - Cast Long to Numeric =====
   Plan hash value: 423740054

   -----------------------------------------------------------------------------------------------------------
   | Id  | Operation                           | Name                | Rows  | Bytes | Cost (%CPU)| Time     |
   -----------------------------------------------------------------------------------------------------------
   |   0 | SELECT STATEMENT                    |                     |     2 |    28 |     5   (0)| 00:00:01 |
   |   1 |  TABLE ACCESS BY INDEX ROWID BATCHED| DATATYPE_TEST       |     2 |    28 |     5   (0)| 00:00:01 |
   |*  2 |   INDEX RANGE SCAN                  | DATATYPE_NUMBER_VAL |     2 |       |     3   (0)| 00:00:01 |
   -----------------------------------------------------------------------------------------------------------

   Predicate Information (identified by operation id):
   ---------------------------------------------------

      2 - access("NUMBER_VAL"=:1)


===== Query Plan - Cast Float to Numeric =====
   Plan hash value: 423740054

   -----------------------------------------------------------------------------------------------------------
   | Id  | Operation                           | Name                | Rows  | Bytes | Cost (%CPU)| Time     |
   -----------------------------------------------------------------------------------------------------------
   |   0 | SELECT STATEMENT                    |                     |     2 |    28 |     5   (0)| 00:00:01 |
   |   1 |  TABLE ACCESS BY INDEX ROWID BATCHED| DATATYPE_TEST       |     2 |    28 |     5   (0)| 00:00:01 |
   |*  2 |   INDEX RANGE SCAN                  | DATATYPE_NUMBER_VAL |     2 |       |     3   (0)| 00:00:01 |
   -----------------------------------------------------------------------------------------------------------

   Predicate Information (identified by operation id):
   ---------------------------------------------------

      2 - access("NUMBER_VAL"=:1)


===== Query Plan - Cast Double to Numeric =====
   Plan hash value: 423740054

   -----------------------------------------------------------------------------------------------------------
   | Id  | Operation                           | Name                | Rows  | Bytes | Cost (%CPU)| Time     |
   -----------------------------------------------------------------------------------------------------------
   |   0 | SELECT STATEMENT                    |                     |     2 |    28 |     5   (0)| 00:00:01 |
   |   1 |  TABLE ACCESS BY INDEX ROWID BATCHED| DATATYPE_TEST       |     2 |    28 |     5   (0)| 00:00:01 |
   |*  2 |   INDEX RANGE SCAN                  | DATATYPE_NUMBER_VAL |     2 |       |     3   (0)| 00:00:01 |
   -----------------------------------------------------------------------------------------------------------

   Predicate Information (identified by operation id):
   ---------------------------------------------------

      2 - access("NUMBER_VAL"=:1)


=========================
Command successfully executed

However in PostgreSQL, the same statement where we convert “int” to “numeric” and “long” to “Numeric” an index scan is executed, however when casting “float” and “double” datatypes to numeric a table scan results. Similar behavior is seen when using the other PostgreSQL datatypes such as “smallint”, “bigint” and “int”. The output is shown below and the PostgreSQL Code is located at the bottom of the post:

java -classpath /Users/shaneborden/Documents/java/postgresql-42.5.0.jar:/Users/shaneborden/Documents/java PostgresJdbcTest
Password: *******
=====  Database info =====
   DatabaseProductName: PostgreSQL
   DatabaseProductVersion: 14.4
   DatabaseMajorVersion: 14
   DatabaseMinorVersion: 4
=====  Driver info =====
   DriverName: PostgreSQL JDBC Driver
   DriverVersion: 42.5.0
   DriverMajorVersion: 42
   DriverMinorVersion: 5
=====  JDBC/DB attributes =====
   Supports getGeneratedKeys(): true
===== Database info =====
   Current Date from Postgres : 2022-12-27 16:25:41.493047-05
   Client connected pid from Postgres : 17727
   Postgres DB Unique Name from Postgres : mytpchdb
   Client connected hostname from Postgres : null
   Client connected application_name from Postgres : PostgreSQL JDBC Driver


===== Query Plan - Cast Int to Numeric =====
   Index Scan using datatype_test_numeric_decimal on datatype_test  (cost=0.43..6.47 rows=2 width=28) (actual time=0.057..0.060 rows=2 loops=1)
     Index Cond: (numeric_val = '10001'::numeric)
   Planning Time: 0.389 ms
   Execution Time: 0.085 ms


===== Query Plan - Cast Long to Numeric =====
   Index Scan using datatype_test_numeric_decimal on datatype_test  (cost=0.43..6.47 rows=2 width=28) (actual time=0.011..0.013 rows=2 loops=1)
     Index Cond: (numeric_val = '10001'::numeric)
   Planning Time: 0.126 ms
   Execution Time: 0.027 ms


===== Query Plan - Cast Float to Numeric =====
   Seq Scan on datatype_test  (cost=0.00..233334.01 rows=50000 width=28) (actual time=1050.733..2622.224 rows=2 loops=1)
     Filter: ((numeric_val)::double precision = '10001'::real)
     Rows Removed by Filter: 9999999
   Planning Time: 0.094 ms
   Execution Time: 2622.273 ms


===== Query Plan - Cast Double to Numeric =====
   Seq Scan on datatype_test  (cost=0.00..233334.01 rows=50000 width=28) (actual time=1055.081..2629.634 rows=2 loops=1)
     Filter: ((numeric_val)::double precision = '10001'::double precision)
     Rows Removed by Filter: 9999999
   Planning Time: 0.096 ms
   Execution Time: 2629.660 ms

As you can see, its very important to also ensure that your datatypes within your code are fully compliant with the destination RDBMS. The “double” and the “float” types within the Java code cause a table scan! While Oracle has become very forgiving with that over the years, PostgreSQL just isn’t there yet and you need to make sure that you adjust your code accordingly!

Code Samples:

Jar / Java Requirements:

  • openjdk 11
  • postgresql-42.5.0.jar
  • ojdbc11.jar

Compile:

To compile the code:
Oracle: javac OracleJdbcTest.java
Postgres: javac PostgresJdbcTest.java

Oracle Java Test Harness:

Note: To execute the code follow the instructions in the comment block at the top of the code. The instructions to create the sample table objects are also contained within the same comment block.

import java.sql.Connection;
import java.sql.DriverManager;
import java.sql.PreparedStatement;
import java.sql.ResultSet;
import java.sql.SQLException;
import java.util.Properties;
import java.sql.*;

/*
 *
 * Simple Java Program to connect Oracle database by using Oracle JDBC thin driver
 * Make sure you have Oracle JDBC thin driver in your classpath before running this program
 * @author
 javac OracleJdbcTest.java
 java -classpath /Users/shaneborden/Documents/java/ojdbc11.jar:/Users/shaneborden/Documents/java OracleJdbcTest
 Setup:
 CREATE TABLE tc.datatype_test (
		number_decimal_val number(12,2), 
		number_val number(12),
    random_val number(4))
  TABLESPACE USERS;
 CREATE SEQUENCE tc.datatype_test_seq
  START WITH     1
  INCREMENT BY   1
  NOCACHE
  NOCYCLE;
 BEGIN
  FOR i in 1 .. 1000000
 LOOP
 INSERT INTO tc.datatype_test VALUES ( 
		tc.datatype_test_seq.nextval,
		floor(dbms_random.value(1, 1000000)),
    floor(dbms_random.value(1, 1000)));
 END LOOP;
 END;
 /

CREATE INDEX tc.datatype_number_decimal_val on tc.datatype_test(number_decimal_val);
CREATE INDEX tc.datatype_number_val on tc.datatype_test(number_val);
*/

public class OracleJdbcTest
{
  public static void main(String args[]) throws SQLException, ClassNotFoundException
  {
    try
    {
      java.io.Console console = System.console();
      Boolean dataTypeCheck = true;
      String sourceDatatType = "Numeric";
      String inputPassword = new String(console.readPassword("Password: "));
      Integer intQueryParam = 10001;
      Long longQueryParam = 10001L;
      Float floatQueryParam = 10001f;
      Double doubleQueryParam = 10001.0;

      /**Set URL of Oracle database server*/
      String url = "jdbc:oracle:thin:@//192.168.1.105:1521/vboxncdb.localdomain.com";
      String xPlanSql = "select * from table(dbms_xplan.display)";
       
      /** properties for creating connection to Oracle database */
      Properties props = new Properties();
      props.setProperty("user", "datatypeTestUser");
      props.setProperty("password",  inputPassword);
       
      /** creating connection to Oracle database using JDBC*/
       
      Connection conn = DriverManager.getConnection(url,props);
      DatabaseMetaData dbmd = conn.getMetaData();
       
      System.out.println("=====  Database info =====");
      System.out.println("   DatabaseProductName: " + dbmd.getDatabaseProductName() );
      System.out.println("   DatabaseProductVersion: " + dbmd.getDatabaseProductVersion() );
      System.out.println("   DatabaseMajorVersion: " + dbmd.getDatabaseMajorVersion() );
      System.out.println("   DatabaseMinorVersion: " + dbmd.getDatabaseMinorVersion() );
      System.out.println("=====  Driver info =====");
      System.out.println("   DriverName: " + dbmd.getDriverName() );
      System.out.println("   DriverVersion: " + dbmd.getDriverVersion() );
      System.out.println("   DriverMajorVersion: " + dbmd.getDriverMajorVersion() );
      System.out.println("   DriverMinorVersion: " + dbmd.getDriverMinorVersion() );
      System.out.println("=====  JDBC/DB attributes =====");
      if (dbmd.supportsGetGeneratedKeys() )
        System.out.println("   Supports getGeneratedKeys(): true");
      else
        System.out.println("   Supports getGeneratedKeys(): false");
      System.out.println("===== Database info =====");
       
      String sql = "with session_data as (";
            sql = sql + "select sysdate as current_day,SYS_CONTEXT ('USERENV', 'DB_UNIQUE_NAME') as db_name,SYS_CONTEXT ('USERENV', 'SERVICE_NAME') as service_name, ";
            sql = sql + "SYS_CONTEXT ('USERENV', 'HOST') as host, SYS_CONTEXT ('USERENV', 'IP_ADDRESS') as ip_address,  SYS_CONTEXT('USERENV','SID') sid from dual) ";
            sql = sql + "select sd.current_day, sd.db_name, sd.service_name, sd.host, sd.ip_address, ";
            sql = sql + "sd.sid, nvl(sci.network_service_banner, 'Traffic Not Encrypted') network_service_banner ";
            sql = sql + "from session_data sd ";
            sql = sql + "left join v$session_connect_info sci on (sd.sid = sci.sid) ";
            sql = sql + "where sci.network_service_banner like '%Crypto-checksumming service adapter%'";
       
      /** creating PreparedStatement object to execute query*/
      PreparedStatement preStatement = conn.prepareStatement(sql);
       
      ResultSet result = preStatement.executeQuery();
       
      while(result.next())
      {
        System.out.println("Current Date from Oracle : " +         result.getString("current_day"));
        System.out.println("Oracle DB Unique Name from Oracle : " +         result.getString("db_name"));
        System.out.println("Oracle Connected Listener Service Name from Oracle : " +         result.getString("service_name"));
        System.out.println("Client connected hostname from Oracle : " +         result.getString("host"));
        System.out.println("Client connected ip_address from Oracle : " +         result.getString("ip_address"));
        System.out.println("Client connected encryption info from Oracle : " +         result.getString("network_service_banner"));
      }


      if (dataTypeCheck)
        if (sourceDatatType == "Numeric122") {
          sql = "EXPLAIN PLAN FOR ";
          sql = sql + "select * from tc.datatype_test where number_decimal_val = ?";
        } else if (sourceDatatType == "Numeric") {
          sql = "EXPLAIN PLAN FOR ";
          sql = sql + "select * from tc.datatype_test where number_val = ?";
        }

        System.out.println("");
        System.out.println("");
        System.out.println("===== Query Plan - Cast Int to "+ sourceDatatType +" =====");

        /** creating PreparedStatement object to execute query*/
        preStatement = conn.prepareStatement(sql);

        preStatement.setInt(1, intQueryParam);
          
        result = preStatement.executeQuery();

        PreparedStatement xPlanStatement = conn.prepareStatement(xPlanSql);
        ResultSet xPlanResult = xPlanStatement.executeQuery();

        while(xPlanResult.next())
        {
            System.out.println("   " + xPlanResult.getString(1));
        }

        System.out.println("");
        System.out.println("");
        System.out.println("===== Query Plan - Cast Long to "+ sourceDatatType +" =====");

        preStatement.setLong(1, longQueryParam);
        
        result = preStatement.executeQuery();

        xPlanStatement = conn.prepareStatement(xPlanSql);
        xPlanResult = xPlanStatement.executeQuery();

        while(xPlanResult.next())
        {
            System.out.println("   " + xPlanResult.getString(1));
        }

        System.out.println("");
        System.out.println("");
        System.out.println("===== Query Plan - Cast Float to "+ sourceDatatType +" =====");

        preStatement.setFloat(1, floatQueryParam);
        
        result = preStatement.executeQuery();

        xPlanStatement = conn.prepareStatement(xPlanSql);
        xPlanResult = xPlanStatement.executeQuery();

        while(xPlanResult.next())
        {
            System.out.println("   " + xPlanResult.getString(1));
        }

        System.out.println("");
        System.out.println("");
        System.out.println("===== Query Plan - Cast Double to "+ sourceDatatType +" =====");

        preStatement.setDouble(1, doubleQueryParam);
        
        result = preStatement.executeQuery();

        xPlanStatement = conn.prepareStatement(xPlanSql);
        xPlanResult = xPlanStatement.executeQuery();

        while(xPlanResult.next())
        {
            System.out.println("   " + xPlanResult.getString(1));
        }

        System.out.println("");
        System.out.println("");

      conn.close();
      System.out.println("=========================");
      System.out.println("Command successfully executed");

    }

    catch(SQLException exp) {
	   System.out.println("Exception: " + exp.getMessage());
	   System.out.println("SQL State: " + exp.getSQLState());
	   System.out.println("Vendor Error: " + exp.getErrorCode());
    }
    
  }
}

PostgreSQL Java Test Harness:

Note: To execute the code follow the instructions in the comment block at the top of the code. The instructions to create the sample table objects are also contained within the same comment block.

import java.sql.Connection;
import java.sql.DriverManager;
import java.sql.PreparedStatement;
import java.sql.ResultSet;
import java.sql.SQLException;
import java.util.Properties;
import java.sql.*;

/*
 *
 * Simple Java Program to connect Postgres database by using Postgres JDBC thin driver
 * Make sure you have Postgres JDBC thin driver in your classpath before running this program
 * @author
 java -classpath /Users/shaneborden/Documents/java/postgresql-42.5.0.jar:/Users/shaneborden/Documents/java PostgresJdbcTest
 Setup:
 CREATE TABLE datatype_test (
		int_val int, 
		bigint_val bigint, 
		numeric_val numeric(12),
    numeric_decimal_val numeric(12,2), 
		smallint_val smallint);
INSERT INTO datatype_test VALUES ( 
		generate_series(0,10000000), 
		generate_series(0,10000000), 
		floor(random()*10000000),
    random()*10000000, 
		floor(random()* (32765-1 + 1) + 1) );

SET SESSION max_parallel_maintenance_workers TO 4;
SET SESSION maintenance_work_mem TO '2 GB';

CREATE INDEX datatype_test_int on datatype_test(int_val);
CREATE INDEX datatype_test_bigint on datatype_test(bigint_val);
CREATE INDEX datatype_test_numeric on datatype_test(numeric_val);
CREATE INDEX datatype_test_numeric_decimal on datatype_test(numeric_val);
CREATE INDEX datatype_test_smallint on datatype_test(smallint_val);
*/

public class PostgresJdbcTest
{
  public static void main(String args[]) throws SQLException, ClassNotFoundException
  {
    try
    {
       java.io.Console console = System.console();
       Boolean dataTypeCheck = true;
       String sourceDatatType = "Numeric";
       String inputPassword = new String(console.readPassword("Password: "));
       Integer intQueryParam = 10001;
       Long longQueryParam = 10001L;
       Float floatQueryParam = 10001f;
       Double doubleQueryParam = 10001.0;

       /**Set URL of Postgres database server*/
        String url = "jdbc:postgresql://localhost:6000/mytpchdb";
       
       /** properties for creating connection to Postgres database */
       Properties props = new Properties();
       props.setProperty("user", "postgres");
       props.setProperty("password",  inputPassword);
       
       /** creating connection to Postgres database using JDBC*/
       
       Connection conn = DriverManager.getConnection(url,props);
       DatabaseMetaData dbmd = conn.getMetaData();
       
       System.out.println("=====  Database info =====");
       System.out.println("   DatabaseProductName: " + dbmd.getDatabaseProductName() );
       System.out.println("   DatabaseProductVersion: " + dbmd.getDatabaseProductVersion() );
       System.out.println("   DatabaseMajorVersion: " + dbmd.getDatabaseMajorVersion() );
       System.out.println("   DatabaseMinorVersion: " + dbmd.getDatabaseMinorVersion() );
       System.out.println("=====  Driver info =====");
       System.out.println("   DriverName: " + dbmd.getDriverName() );
       System.out.println("   DriverVersion: " + dbmd.getDriverVersion() );
       System.out.println("   DriverMajorVersion: " + dbmd.getDriverMajorVersion() );
       System.out.println("   DriverMinorVersion: " + dbmd.getDriverMinorVersion() );
       System.out.println("=====  JDBC/DB attributes =====");
       if (dbmd.supportsGetGeneratedKeys() )
         System.out.println("   Supports getGeneratedKeys(): true");
       else
         System.out.println("   Supports getGeneratedKeys(): false");
       System.out.println("===== Database info =====");
       
       String sql = "select now() as current_day,current_database() as db_name, ";
              sql = sql + "client_hostname as host, application_name, pid from pg_stat_activity ";
              sql = sql + " where pid = pg_backend_pid() ";
       
       /** creating PreparedStatement object to execute query*/
       PreparedStatement preStatement = conn.prepareStatement(sql);
       
       ResultSet result = preStatement.executeQuery();
       
       while(result.next())
       {
           System.out.println("   Current Date from Postgres : " +         result.getString("current_day"));
           System.out.println("   Client connected pid from Postgres : " +         result.getString("pid"));
           System.out.println("   Postgres DB Unique Name from Postgres : " +         result.getString("db_name"));
           System.out.println("   Client connected hostname from Postgres : " +         result.getString("host"));
           System.out.println("   Client connected application_name from Postgres : " +         result.getString("application_name"));
       }

       if (dataTypeCheck)
          if (sourceDatatType == "Int") {
            sql = "EXPLAIN (ANALYZE, COSTS)";
            sql = sql + "select * from datatype_test where int_val = ?";
          } else if (sourceDatatType == "Bigint") {
            sql = "EXPLAIN (ANALYZE, COSTS)";
            sql = sql + "select * from datatype_test where bigint_val = ?";
          } else if (sourceDatatType == "Numeric") {
            sql = "EXPLAIN (ANALYZE, COSTS)";
            sql = sql + "select * from datatype_test where numeric_val = ?";
          } else if (sourceDatatType == "Numeric122") {
            sql = "EXPLAIN (ANALYZE, COSTS)";
            sql = sql + "select * from datatype_test where numeric_val = ?";
          } else if (sourceDatatType == "Smallint") {
            sql = "EXPLAIN (ANALYZE, COSTS)";
            sql = sql + "select * from datatype_test where smallint_val = ?";
          }

          Statement stmt = conn.createStatement();
          stmt.execute("SET max_parallel_workers_per_gather = 0");

          System.out.println("");
          System.out.println("");
          System.out.println("===== Query Plan - Cast Int to "+ sourceDatatType +" =====");

          /** creating PreparedStatement object to execute query*/
          preStatement = conn.prepareStatement(sql);

          preStatement.setInt(1, intQueryParam);
          
          result = preStatement.executeQuery();
          
          while(result.next())
          {
              System.out.println("   " + result.getString(1));
          }

          System.out.println("");
          System.out.println("");
          System.out.println("===== Query Plan - Cast Long to "+ sourceDatatType +" =====");

          preStatement.setLong(1, longQueryParam);
          
          result = preStatement.executeQuery();
          
          while(result.next())
          {
            System.out.println("   " + result.getString(1));
          }

          System.out.println("");
          System.out.println("");
          System.out.println("===== Query Plan - Cast Float to "+ sourceDatatType +" =====");

          preStatement.setFloat(1, floatQueryParam);
          
          result = preStatement.executeQuery();
          
          while(result.next())
          {
            System.out.println("   " + result.getString(1));
          }

          System.out.println("");
          System.out.println("");
          System.out.println("===== Query Plan - Cast Double to "+ sourceDatatType +" =====");

          preStatement.setDouble(1, doubleQueryParam);
          
          result = preStatement.executeQuery();
          
          while(result.next())
          {
            System.out.println("   " + result.getString(1));
          }

          System.out.println("");
          System.out.println("");

      conn.close();
      System.out.println("=========================");
      System.out.println("Command successfully executed");

    }

    catch(SQLException exp) {
	   System.out.println("Exception: " + exp.getMessage());
	   System.out.println("SQL State: " + exp.getSQLState());
	   System.out.println("Vendor Error: " + exp.getErrorCode());
    }
    
  }
}

Tuning the PostgreSQL “random_page_cost” Parameter

In my previous post “Three Configuration Parameters for PostgreSQL That Are Worth Further Investigation!“, I introduced three PostgreSQL parameters that I feel are the most “neglected” and present the most opportunity for performance tuning in a PostgreSQL instance. I’ve previously posted parts 1 and 2 which cover “work_mem” and “effective_io_concurrency“, so in the final part of this series, I would like to demonstrate tuning the “random_page_cost” parameter.

Because PostgreSQL has the ability to be installed on many different types of systems, the default for this parameter represents a system that is likely the least performant, one that has low CPU and a disk subsystem that is less than ideal. This setting can be overridden at the individual object level as well, however that may represent a management nightmare so I would recommend against that. A good explanation of the parameter exists here, and for most CloudSQL instances, should likely be set lower than the default because random page costs are expected to be less expensive on the types of I/O subsystems are present within today’s cloud environments.

For those of you that come from Oracle backgrounds, this parameter is very much like the “OPTIMIZER_INDEX_COST_ADJ” parameter that we used to manipulate in older Oracle versions. To refresh your mind on this parameter you can see the 19c explanation here.

As a simple example of how the query plan can change for a simple SQL, I will first show the query plan with the default setting of 4. While it is using an index, the access path could be better:

set max_parallel_workers_per_gather = 0;
set session random_page_cost to 4;

explain (analyze, verbose, costs, settings, buffers, wal, timing, summary, format text)
SELECT c.c_name, c.c_acctbal, sum(o.o_totalprice)
FROM orders o
JOIN customer c ON (c.c_custkey = o.o_custkey)
WHERE c.c_custkey = 30003 and o.o_orderstatus = 'O'
GROUP BY c.c_name, c.c_acctbal;

                                                                             QUERY PLAN
--------------------------------------------------------------------------------------------------------------------------------------------------------------------
 GroupAggregate  (cost=76.28..76.37 rows=1 width=57) (actual time=0.034..0.035 rows=0 loops=1)
   Output: c.c_name, c.c_acctbal, sum(o.o_totalprice)
   Group Key: c.c_name, c.c_acctbal
   Buffers: shared hit=7
   ->  Sort  (cost=76.28..76.30 rows=8 width=33) (actual time=0.033..0.034 rows=0 loops=1)
         Output: c.c_name, c.c_acctbal, o.o_totalprice
         Sort Key: c.c_name, c.c_acctbal
         Sort Method: quicksort  Memory: 25kB
         Buffers: shared hit=7
         ->  Nested Loop  (cost=4.97..76.16 rows=8 width=33) (actual time=0.027..0.028 rows=0 loops=1)
               Output: c.c_name, c.c_acctbal, o.o_totalprice
               Buffers: shared hit=7
               ->  Index Scan using customer_pk on public.customer c  (cost=0.42..8.44 rows=1 width=31) (actual time=0.014..0.015 rows=1 loops=1)
                     Output: c.c_custkey, c.c_mktsegment, c.c_nationkey, c.c_name, c.c_address, c.c_phone, c.c_acctbal, c.c_comment
                     Index Cond: (c.c_custkey = '30003'::numeric)
                     Buffers: shared hit=4
               ->  Bitmap Heap Scan on public.orders o  (cost=4.55..67.64 rows=8 width=14) (actual time=0.009..0.009 rows=0 loops=1)
                     Output: o.o_orderdate, o.o_orderkey, o.o_custkey, o.o_orderpriority, o.o_shippriority, o.o_clerk, o.o_orderstatus, o.o_totalprice, o.o_comment
                     Recheck Cond: (o.o_custkey = '30003'::numeric)
                     Filter: (o.o_orderstatus = 'O'::bpchar)
                     Buffers: shared hit=3
                     ->  Bitmap Index Scan on order_customer_fkidx  (cost=0.00..4.55 rows=16 width=0) (actual time=0.008..0.008 rows=0 loops=1)
                           Index Cond: (o.o_custkey = '30003'::numeric)
                           Buffers: shared hit=3
 Settings: effective_cache_size = '3053008kB', effective_io_concurrency = '10', max_parallel_workers_per_gather = '0', work_mem = '512MB'
 Query Identifier: 7272380376793434809
 Planning:
   Buffers: shared hit=2
 Planning Time: 0.234 ms
 Execution Time: 0.076 ms

And now with a change to a setting of 2, we get a different access path:

set max_parallel_workers_per_gather = 0;
set session random_page_cost to 2;

explain (analyze, verbose, costs, settings, buffers, wal, timing, summary, format text)
SELECT c.c_name, c.c_acctbal, sum(o.o_totalprice)
FROM orders o
JOIN customer c ON (c.c_custkey = o.o_custkey)
WHERE c.c_custkey = 30003 and o.o_orderstatus = 'O'
GROUP BY c.c_name, c.c_acctbal;

                                                                             QUERY PLAN
--------------------------------------------------------------------------------------------------------------------------------------------------------------------
 GroupAggregate  (cost=39.38..39.48 rows=1 width=57) (actual time=0.027..0.028 rows=0 loops=1)
   Output: c.c_name, c.c_acctbal, sum(o.o_totalprice)
   Group Key: c.c_name, c.c_acctbal
   Buffers: shared hit=7
   ->  Sort  (cost=39.38..39.40 rows=8 width=33) (actual time=0.026..0.027 rows=0 loops=1)
         Output: c.c_name, c.c_acctbal, o.o_totalprice
         Sort Key: c.c_name, c.c_acctbal
         Sort Method: quicksort  Memory: 25kB
         Buffers: shared hit=7
         ->  Nested Loop  (cost=0.85..39.26 rows=8 width=33) (actual time=0.021..0.022 rows=0 loops=1)
               Output: c.c_name, c.c_acctbal, o.o_totalprice
               Buffers: shared hit=7
               ->  Index Scan using customer_pk on public.customer c  (cost=0.42..4.44 rows=1 width=31) (actual time=0.012..0.012 rows=1 loops=1)
                     Output: c.c_custkey, c.c_mktsegment, c.c_nationkey, c.c_name, c.c_address, c.c_phone, c.c_acctbal, c.c_comment
                     Index Cond: (c.c_custkey = '30003'::numeric)
                     Buffers: shared hit=4
               ->  Index Scan using order_customer_fkidx on public.orders o  (cost=0.43..34.75 rows=8 width=14) (actual time=0.008..0.008 rows=0 loops=1)
                     Output: o.o_orderdate, o.o_orderkey, o.o_custkey, o.o_orderpriority, o.o_shippriority, o.o_clerk, o.o_orderstatus, o.o_totalprice, o.o_comment
                     Index Cond: (o.o_custkey = '30003'::numeric)
                     Filter: (o.o_orderstatus = 'O'::bpchar)
                     Buffers: shared hit=3
 Settings: effective_cache_size = '3053008kB', effective_io_concurrency = '10', max_parallel_workers_per_gather = '0', random_page_cost = '2', work_mem = '512MB'
 Query Identifier: 7272380376793434809
 Planning:
   Buffers: shared hit=2
 Planning Time: 0.199 ms
 Execution Time: 0.064 ms

Now, for this simple example, the execution time isn’t vastly different, because in both cases an index is being used, however, in cases where the parameter adjustment allows an index to be used over a sequential scan, you will really see the benefit.

Ultimately, there are some other parameters that may benefit from adjustment such as the “cpu_*” parameters, however, those will require much more testing and experimentation over the adjustment of “random_page_cost” especially if your system is running SSDs as in most Google CloudSQL for Postgres instances or even Google AlloyDB where the I/O subsystem is built specifically for the implementation. And if you use either of these implementations, I would highly consider updating this parameter from the default of 4 to at least 2, maybe even 1.1 depending on the shape that you have chosen and the I/O limits served by each Shape.

Enjoy!

Tuning the PostgreSQL “effective_io_concurrency” Parameter

In my previous post “Three Configuration Parameters for PostgreSQL That Are Worth Further Investigation!“, I introduced three PostgreSQL parameters that I feel are the most “neglected” and present the most opportunity for performance tuning in a PostgreSQL instance. I’ve previously discussed “work_mem” in a previous post, so in Part 2 of this series, I would like to demonstrate tuning the “effective_io_concurrency” parameter. While this parameter has been discussed in other blogs, I will attempt to make this discussion relevant to how it might affect a CloudSQL instance.

The parameter “effective_io_concurrency” reflects the number of simultaneous requests that can be handled efficiently by the disk subsystem. One thing to keep in mind is that currently this parameter only effects “bitmap_heap_scans” where the data is not already present in the shared buffer. In general, if using spinning HDD devices, this should be set to reflect the number of drives that participate in the RAID stripe. In cases where SSDs are used, you can set this value much higher, although you must take into account any Quality of Service I/O ops limits which are usually present in a cloud implementation. A full explanation of the parameter can be found here.

To do a simple demonstration of how this parameter can effect queries, I set up a small Google CloudSQL for Postgres instance (2 vCPU X 8GB memory) and loaded up some tables, then executed a query that ensured a “bitmap heap scan” changing “effective_io_concurrency” parameter between each test. In addition, the instance was bounced before each test to ensure that the shared buffers were cleared.

Setup:

CREATE TABLE public.effective_io_concurrency_test (
		id int PRIMARY KEY, 
		value numeric,
		product_id int,
		effective_date timestamp(3)
		);
INSERT INTO public.effective_io_concurrency_test VALUES ( 
		generate_series(0,100000000), 
		random()*1000,
		random()*100,
		current_timestamp(3));

CREATE INDEX prod_id_idx ON public.effective_io_concurrency_test (product_id);
VACUUM ANALYZE public.effective_io_concurrency_test;

Execution:

The resulting query plans did not show any variation in execution path or cost, but the timings did vary across the tests.

EXPLAIN (analyze, verbose, costs, settings, buffers, wal, timing, summary, format text)
SELECT * FROM public.effective_io_concurrency_test
WHERE id BETWEEN 10000 AND 100000;

-------------------------------------------------------------------------------------------------------------------------------------------------------------------------------------------------------------------------------
 Bitmap Heap Scan on public.effective_io_concurrency_test  (cost=7035.15..522009.95 rows=547023 width=27) (actual time=293.542..33257.631 rows=588784 loops=1)
   Output: id, value, product_id, effective_date
   Recheck Cond: (((effective_io_concurrency_test.id >= 10000) AND (effective_io_concurrency_test.id = 100) AND (effective_io_concurrency_test.product_id   BitmapOr  (cost=7035.15..7035.15 rows=547450 width=0) (actual time=156.951..156.954 rows=0 loops=1)
         Buffers: shared hit=6 read=668
         I/O Timings: read=24.501
         ->  Bitmap Index Scan on effective_io_concurrency_test_pkey  (cost=0.00..1459.74 rows=94117 width=0) (actual time=14.908..14.908 rows=90001 loops=1)
               Index Cond: ((effective_io_concurrency_test.id >= 10000) AND (effective_io_concurrency_test.id   Bitmap Index Scan on prod_id_idx  (cost=0.00..5301.90 rows=453333 width=0) (actual time=142.040..142.040 rows=499255 loops=1)
               Index Cond: ((effective_io_concurrency_test.product_id >= 100) AND (effective_io_concurrency_test.product_id <= 200))
               Buffers: shared hit=3 read=421
               I/O Timings: read=14.154
 Settings: effective_cache_size = '3259448kB', effective_io_concurrency = '8', random_page_cost = '2', work_mem = '512MB'
 Query Identifier: -8974663893066369302
 Planning:
   Buffers: shared hit=103 read=17
   I/O Timings: read=26.880
 Planning Time: 28.350 ms
 Execution Time: 33322.389 ms

Summary:

effective_io_concurrencyQuery Time
1 /* CloudSQL Default */194708.918 ms
2 /* Equal number of CPU */107953.205 ms
4 /* 2x number of CPU */58161.010 ms
8 /* 4x number of CPU */33322.389 ms
10 /* 5x number of CPU */30118.593 ms
20 /* 6x number of CPU */28758.106 ms

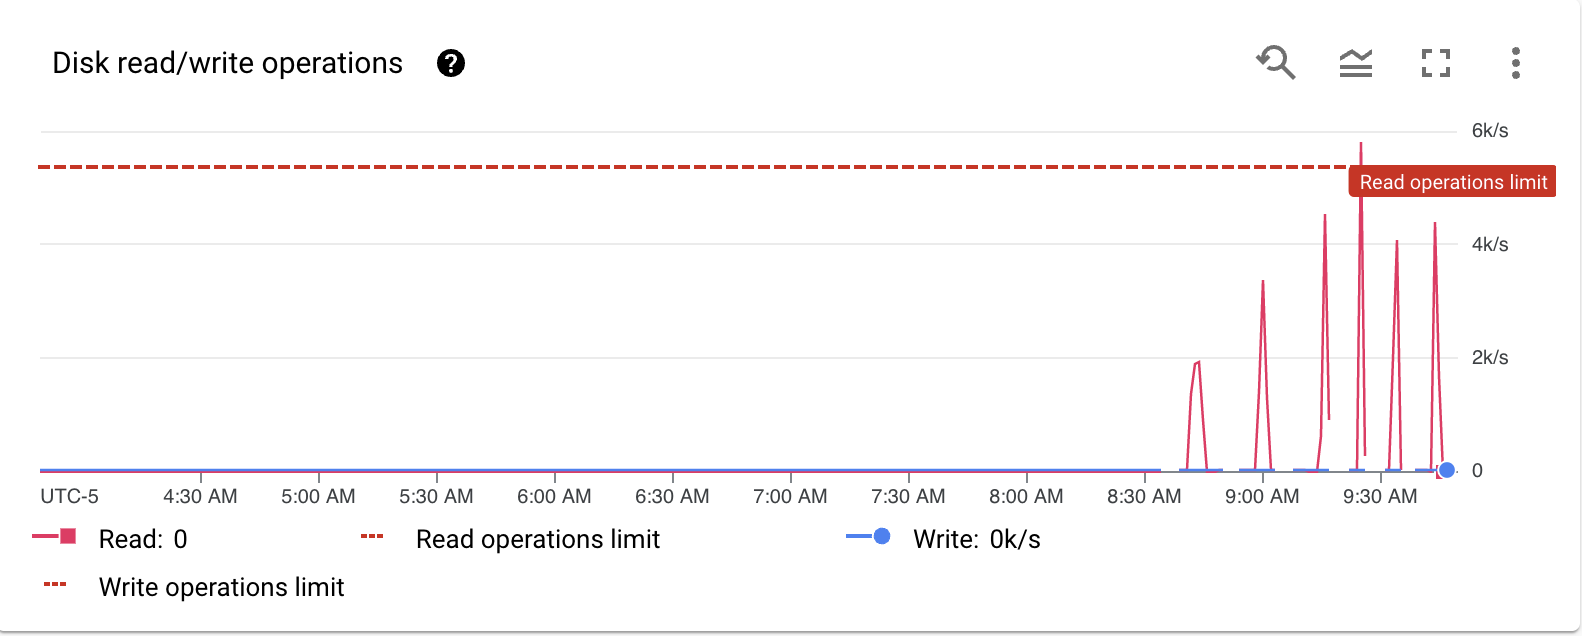
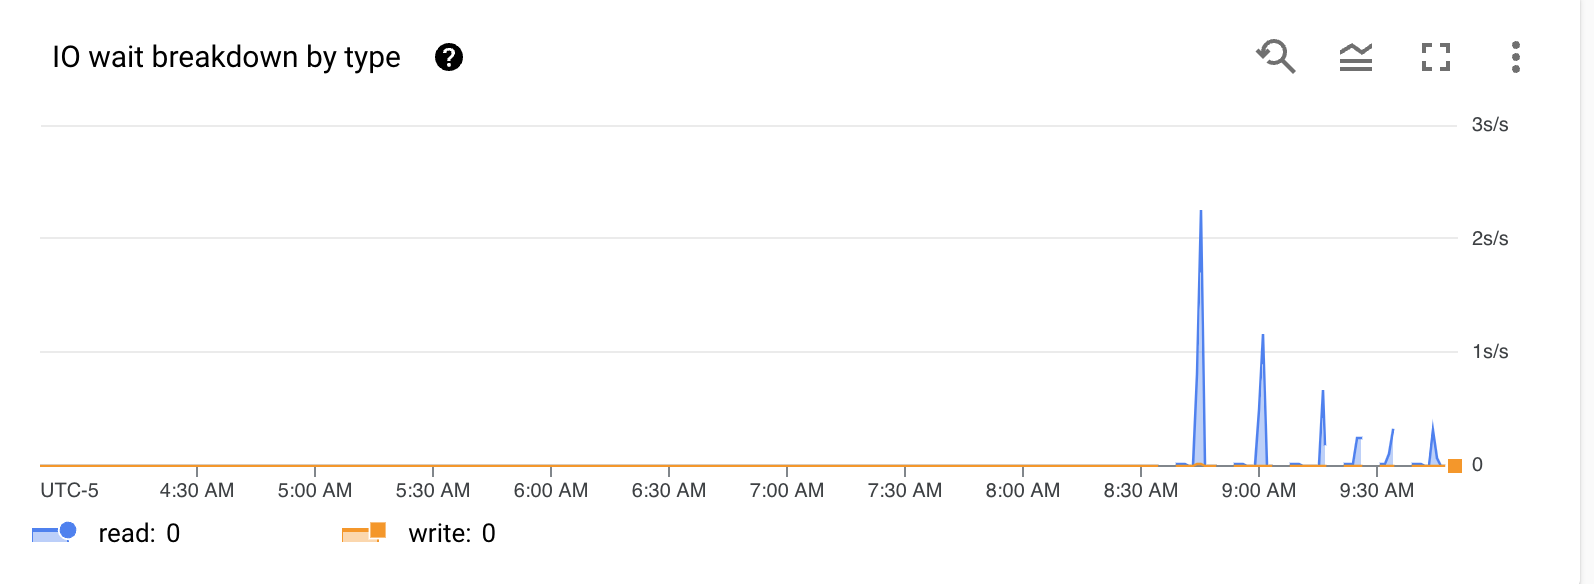
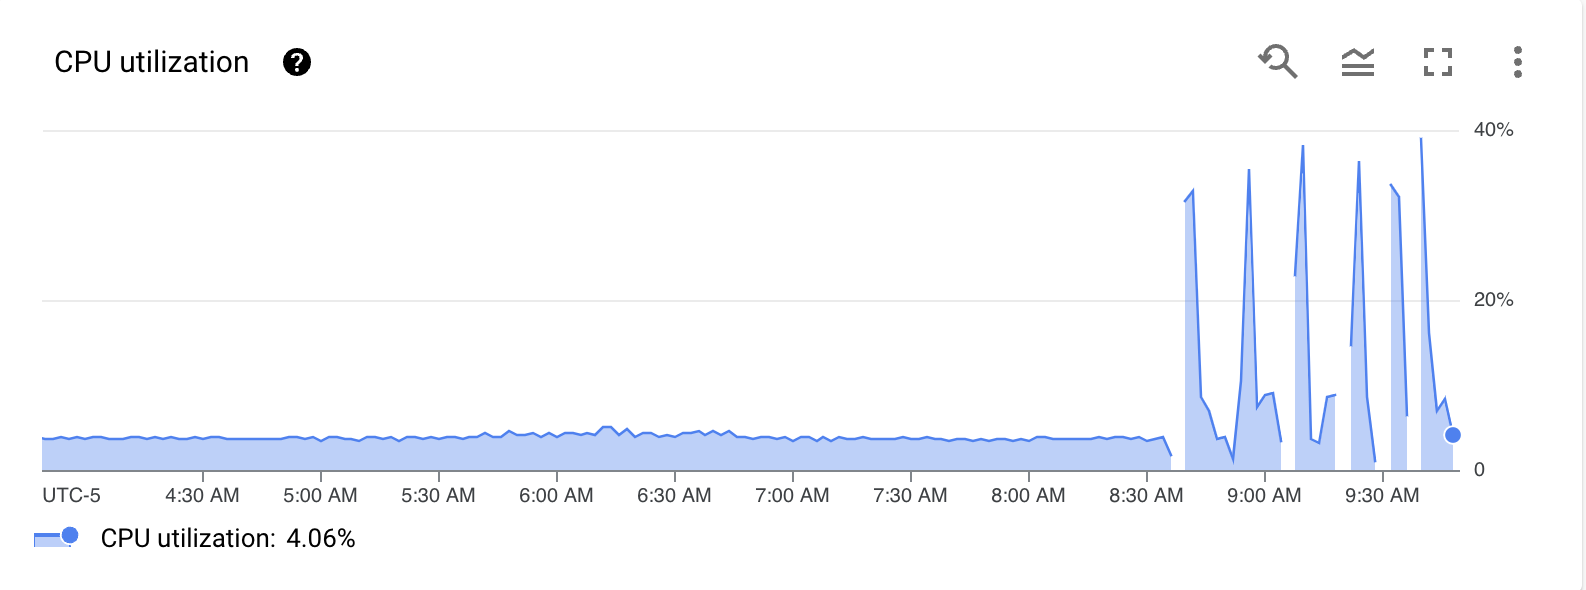
As you can see, there is a diminishing return as we increased the parameter, but why? Upon looking at Google Cloud Console “System Insights” the reason was clear.

**** One thing to note, is that the CPU Utilization spike is a result of the shutdown and restart of the instance between each test. The utilization following the spike represents the utilization found during the test itself.

The Conclusion:

While CPU utilization didn’t hit any limit, the IOPS limits for that CloudSQL shape did. You can add IOPS by changing the shape, but the point of this was to show that the optimal setting always depends on your workload and instance shape. In this case and for this CloudSQL shape, you might actually want to choose a setting of “4” which represents a setting of 2x the number of CPU and one that doesn’t quite max out the guaranteed IOPS. The setting doesn’t get you the fastest query time, but does leave resources left over for other queries to execute at the same time.

As always, be sure to test any changed in your own system and balance accordingly because your “mileage may vary” depending on your individual situation. That being said, in almost no cases is the default setting acceptable unless you are running HDD or on an OS which lacks “posix_fadvise” function (like MacOS or Solaris).

Enjoy!

Tuning the PostgreSQL “work_mem” Parameter

In my previous post “Three Configuration Parameters for PostgreSQL That Are Worth Further Investigation!“, I introduced three PostgreSQL parameters that I feel are the most “neglected” and present the most opportunity for performance tuning in a PostgreSQL instance. In the first of what will become a three part series, I would like to demonstrate tuning the “work_mem” parameter.

The “work_mem” parameter optimizes database operations such as:

  • sorts
  • bitmap heap scans
  • hash joins
  • materialized common table expressions (WITH statements)

To get started, lets create a test table with 100M rows of data:

CREATE TABLE public.work_mem_test (
		id int PRIMARY KEY, 
		value numeric,
		product_id int,
		effective_date timestamp(3)
		);
INSERT INTO public.work_mem_test VALUES ( 
		generate_series(0,100000000), 
		random()*1000,
		random()*100,
		current_timestamp(3));

CREATE INDEX prod_value_idx ON public.work_mem_test (product_id);
VACUUM ANALYZE public.work_mem_test;

We will then run an explain analyze with the “COSTS, BUFFERS, VERBOSE” options so that we can fully see what is going on with the query. For demonstration purposes, I have set the “work_mem” to the lowest possible setting of 64kB. In addition, so that we don’t get the variability of parallel processing I have set the “max_parallel_workers_per_gather” to zero to disable parallel processing. Most systems may also experience better gains than this test case as this was a very small 2 vCPU / 8GB Google CloudSQL PostgreSQL instance:

set session work_mem to '64kB';
set max_parallel_workers_per_gather = 0;
set effective_io_concurrency = 20;
EXPLAIN (ANALYZE, COSTS, VERBOSE, BUFFERS)
SELECT * FROM public.work_mem_test
WHERE id BETWEEN 10000 AND 100000
OR product_id BETWEEN 100 AND 200
ORDER BY value NULLS FIRST;

---------------------------------------------------------------------------------------------------------------------------------------------------------------------
 Sort  (cost=2640424.97..2641959.63 rows=613866 width=27) (actual time=16593.228..16778.132 rows=589379 loops=1)
   Output: id, value, product_id, effective_date
   Sort Key: work_mem_test.value NULLS FIRST
   Sort Method: external merge  Disk: 24248kB
   Buffers: shared hit=6 read=363702, temp read=15340 written=16486
   I/O Timings: read=4120.104
   ->  Bitmap Heap Scan on public.work_mem_test  (cost=7805.12..2539439.23 rows=613866 width=27) (actual time=82.454..15413.822 rows=589379 loops=1)
         Output: id, value, product_id, effective_date
         Recheck Cond: (((work_mem_test.id >= 10000) AND (work_mem_test.id <= 100000)) OR ((work_mem_test.product_id >= 100) AND (work_mem_test.product_id <= 200)))
         Rows Removed by Index Recheck: 48506004
         Heap Blocks: exact=2058 lossy=360975
         Buffers: shared hit=6 read=363702
         I/O Timings: read=4120.104
         ->  BitmapOr  (cost=7805.12..7805.12 rows=614306 width=0) (actual time=80.340..80.342 rows=0 loops=1)
               Buffers: shared hit=6 read=669
               I/O Timings: read=17.683
               ->  Bitmap Index Scan on work_mem_test_pkey  (cost=0.00..1280.95 rows=82638 width=0) (actual time=12.680..12.680 rows=90001 loops=1)
                     Index Cond: ((work_mem_test.id >= 10000) AND (work_mem_test.id <= 100000))
                     Buffers: shared hit=3 read=247
                     I/O Timings: read=7.831
               ->  Bitmap Index Scan on prod_value_idx  (cost=0.00..6217.24 rows=531667 width=0) (actual time=67.657..67.657 rows=499851 loops=1)
                     Index Cond: ((work_mem_test.product_id >= 100) AND (work_mem_test.product_id <= 200))
                     Buffers: shared hit=3 read=422
                     I/O Timings: read=9.852
 Query Identifier: 731698457235411789
 Planning:
   Buffers: shared hit=39 read=2
   I/O Timings: read=2.588
 Planning Time: 3.136 ms
 Execution Time: 16811.970 ms
(30 rows)

Time: 16903.784 ms (00:16.904)

EXPLAIN, via the BUFFERS keyword gives us the following data points:

Rows Removed by Index Recheck: 48506004
Heap Blocks: exact=2058 lossy=360975


Execution Time: 16811.970 ms

This essentially means that the 64kB of work_mem can hold 2058 blocks in the bitmap structure within that work_mem size. To get the remainder of the results, everything that falls out of that bitmap
are lossy blocks, meaning that they don’t point to an exact tuple, but to rather a block with many tuples. The recheck condition then checks that block for the tuples the query is looking for.

The following formula is a starting point, but may or may not give you the exact setting needed based on various factors. Since we used the lowest possible work_mem, the setting becomes a multiple of that:

new_mem_in_mbytes = 
 ((exact heap blocks + lossy heap blocks) / exact heap blocks) * work_mem_in_bytes / 1048576
= ceil(round(((2058 + 360975) / 2058) * 65536 / 1048576,1))
= 11MB

Note: In most cases, I have found that this formula has worked well on the first pass, however as you will see in the subsequent tests, this estimated work_mem setting wasn’t quite close to the actual amount needed and this is likely due to a mis-estimate by the planner

Reducing the Lossy Block Access

So for the next test I will increase the “work_mem” to 11MB and re-execute the test.

set session work_mem to '11MB';
EXPLAIN (ANALYZE, COSTS, VERBOSE, BUFFERS)
SELECT * FROM public.work_mem_test
WHERE id BETWEEN 10000 AND 100000
OR product_id BETWEEN 100 AND 200
ORDER BY value NULLS FIRST;

---------------------------------------------------------------------------------------------------------------------------------------------------------------------
 Sort  (cost=2160340.77..2161875.43 rows=613866 width=27) (actual time=11382.002..11574.572 rows=589379 loops=1)
   Output: id, value, product_id, effective_date
   Sort Key: work_mem_test.value NULLS FIRST
   Sort Method: external merge  Disk: 24232kB
   Buffers: shared hit=23329 read=340379, temp read=3029 written=3034
   I/O Timings: read=3618.302
   ->  Bitmap Heap Scan on public.work_mem_test  (cost=7805.12..2090832.53 rows=613866 width=27) (actual time=185.251..10923.764 rows=589379 loops=1)
         Output: id, value, product_id, effective_date
         Recheck Cond: (((work_mem_test.id >= 10000) AND (work_mem_test.id = 100) AND (work_mem_test.product_id   BitmapOr  (cost=7805.12..7805.12 rows=614306 width=0) (actual time=132.954..132.957 rows=0 loops=1)
               Buffers: shared hit=675
               ->  Bitmap Index Scan on work_mem_test_pkey  (cost=0.00..1280.95 rows=82638 width=0) (actual time=4.449..4.450 rows=90001 loops=1)
                     Index Cond: ((work_mem_test.id >= 10000) AND (work_mem_test.id   Bitmap Index Scan on prod_value_idx  (cost=0.00..6217.24 rows=531667 width=0) (actual time=128.503..128.503 rows=499851 loops=1)
                     Index Cond: ((work_mem_test.product_id >= 100) AND (work_mem_test.product_id <= 200))
                     Buffers: shared hit=425
 Query Identifier: 731698457235411789
 Planning:
   Buffers: shared hit=30
 Planning Time: 0.179 ms
 Execution Time: 11611.071 ms
(26 rows)

Time: 11695.952 ms (00:11.696)

With 11MB, we got more exact heap blocks, but still not enough memory to process. Applying the formula based on the execution plan of the query….

new_mem_in_mbytes = 
 ((exact heap blocks + lossy heap blocks) / exact heap blocks) * work_mem_in_bytes / 1048576
= ceil(round(((164090 + 198943) / 164090) * 12582912 / 1048576,1));
= 24MB


Let’s increase just a little bit more to 24MB as the latest iteration of the formula has suggested.

set session work_mem to '24MB';
EXPLAIN (ANALYZE, COSTS, VERBOSE, BUFFERS)
SELECT * FROM public.work_mem_test
WHERE id BETWEEN 10000 AND 100000
OR product_id BETWEEN 100 AND 200
ORDER BY value NULLS FIRST;

---------------------------------------------------------------------------------------------------------------------------------------------------------------------
 Sort  (cost=1709385.33..1710919.99 rows=613866 width=27) (actual time=3651.589..3791.250 rows=589379 loops=1)
   Output: id, value, product_id, effective_date
   Sort Key: work_mem_test.value NULLS FIRST
   Sort Method: external merge  Disk: 24232kB
   Buffers: shared hit=23329 read=340379, temp read=3029 written=3031
   I/O Timings: read=1493.162
   ->  Bitmap Heap Scan on public.work_mem_test  (cost=7805.12..1639877.09 rows=613866 width=27) (actual time=348.261..3201.421 rows=589379 loops=1)
         Output: id, value, product_id, effective_date
         Recheck Cond: (((work_mem_test.id >= 10000) AND (work_mem_test.id = 100) AND (work_mem_test.product_id   BitmapOr  (cost=7805.12..7805.12 rows=614306 width=0) (actual time=188.309..188.311 rows=0 loops=1)
               Buffers: shared hit=675
               ->  Bitmap Index Scan on work_mem_test_pkey  (cost=0.00..1280.95 rows=82638 width=0) (actual time=5.090..5.091 rows=90001 loops=1)
                     Index Cond: ((work_mem_test.id >= 10000) AND (work_mem_test.id   Bitmap Index Scan on prod_value_idx  (cost=0.00..6217.24 rows=531667 width=0) (actual time=183.215..183.215 rows=499851 loops=1)
                     Index Cond: ((work_mem_test.product_id >= 100) AND (work_mem_test.product_id <= 200))
                     Buffers: shared hit=425
 Query Identifier: 731698457235411789
 Planning:
   Buffers: shared hit=30
 Planning Time: 0.242 ms
 Execution Time: 3828.215 ms
(25 rows)

Time: 3912.670 ms (00:03.913)

No more lossy block scans! Time has also reduced quite significantly from the first execution.

Handling the Sort Method

Now, we need to pay attention to the explain plan line:

 "Bitmap Heap Scan on public.work_mem_test….rows=613866 width=27" 
 "Sort Method: external merge Disk: 24232kB."

Some of the sort is in memory and some is spilled to disk. So in order to fit the entire rowset in memory, we must multiply the input rows by the width, which is 16MB. In addition, the planner spilled another 24MB to disk, so let’s add that also to “work_mem”.

16Mb + 24Mb which is being spilled = 40Mb more "work_mem"

So with the current “work_mem” of 24MB plus the additional computed to remove the sort (rounded up), the total needed is 64MB.

Lets run one more test:

set session work_mem to '64MB';
EXPLAIN (ANALYZE, COSTS, VERBOSE, BUFFERS)
SELECT * FROM public.work_mem_test
WHERE id BETWEEN 10000 AND 100000
OR product_id BETWEEN 100 AND 200
ORDER BY value NULLS FIRST;

---------------------------------------------------------------------------------------------------------------------------------------------------------------------
 Sort  (cost=613087.41..614622.07 rows=613866 width=27) (actual time=3186.918..3309.896 rows=589379 loops=1)
   Output: id, value, product_id, effective_date
   Sort Key: work_mem_test.value NULLS FIRST
   Sort Method: quicksort  Memory: 61169kB
   Buffers: shared hit=6 read=363702
   I/O Timings: read=1306.892
   ->  Bitmap Heap Scan on public.work_mem_test  (cost=7805.12..554071.67 rows=613866 width=27) (actual time=245.348..2908.344 rows=589379 loops=1)
         Output: id, value, product_id, effective_date
         Recheck Cond: (((work_mem_test.id >= 10000) AND (work_mem_test.id = 100) AND (work_mem_test.product_id   BitmapOr  (cost=7805.12..7805.12 rows=614306 width=0) (actual time=115.051..115.053 rows=0 loops=1)
               Buffers: shared hit=6 read=669
               I/O Timings: read=3.561
               ->  Bitmap Index Scan on work_mem_test_pkey  (cost=0.00..1280.95 rows=82638 width=0) (actual time=6.160..6.161 rows=90001 loops=1)
                     Index Cond: ((work_mem_test.id >= 10000) AND (work_mem_test.id   Bitmap Index Scan on prod_value_idx  (cost=0.00..6217.24 rows=531667 width=0) (actual time=108.889..108.889 rows=499851 loops=1)
                     Index Cond: ((work_mem_test.product_id >= 100) AND (work_mem_test.product_id <= 200))
                     Buffers: shared hit=3 read=422
                     I/O Timings: read=2.231
 Query Identifier: 731698457235411789
 Planning:
   Buffers: shared hit=30
 Planning Time: 0.180 ms
 Execution Time: 3347.271 ms
(28 rows)

Time: 3431.188 ms (00:03.431)

With that adjustment, we have significantly increased the efficiency and performance of the query. From the beginning, just by tuning “work_mem”, we have shaved approximately 13.5 seconds of processing time!

What about a top-N Heapsort??

Now if we want to demonstrate a top-N Heapsort, we can change the query just a little bit more:

set session work_mem to '64MB';
EXPLAIN (ANALYZE, COSTS, VERBOSE, BUFFERS)
SELECT * FROM public.work_mem_test
WHERE id BETWEEN 10000 AND 100000
OR product_id BETWEEN 100 AND 200
ORDER BY value NULLS FIRST LIMIT 10;

---------------------------------------------------------------------------------------------------------------------------------------------------------------------------
 Limit  (cost=567337.09..567337.12 rows=10 width=27) (actual time=3021.185..3021.190 rows=10 loops=1)
   Output: id, value, product_id, effective_date
   Buffers: shared hit=6 read=363702
   I/O Timings: read=1313.044
   ->  Sort  (cost=567337.09..568871.76 rows=613866 width=27) (actual time=3021.183..3021.186 rows=10 loops=1)
         Output: id, value, product_id, effective_date
         Sort Key: work_mem_test.value NULLS FIRST
         Sort Method: top-N heapsort  Memory: 26kB
         Buffers: shared hit=6 read=363702
         I/O Timings: read=1313.044
         ->  Bitmap Heap Scan on public.work_mem_test  (cost=7805.12..554071.67 rows=613866 width=27) (actual time=235.909..2911.978 rows=589379 loops=1)
               Output: id, value, product_id, effective_date
               Recheck Cond: (((work_mem_test.id >= 10000) AND (work_mem_test.id = 100) AND (work_mem_test.product_id   BitmapOr  (cost=7805.12..7805.12 rows=614306 width=0) (actual time=108.429..108.431 rows=0 loops=1)
                     Buffers: shared hit=6 read=669
                     I/O Timings: read=3.114
                     ->  Bitmap Index Scan on work_mem_test_pkey  (cost=0.00..1280.95 rows=82638 width=0) (actual time=5.582..5.582 rows=90001 loops=1)
                           Index Cond: ((work_mem_test.id >= 10000) AND (work_mem_test.id   Bitmap Index Scan on prod_value_idx  (cost=0.00..6217.24 rows=531667 width=0) (actual time=102.845..102.845 rows=499851 loops=1)
                           Index Cond: ((work_mem_test.product_id >= 100) AND (work_mem_test.product_id <= 200))
                           Buffers: shared hit=3 read=422
                           I/O Timings: read=2.037
 Query Identifier: 4969544646514690020
 Planning:
   Buffers: shared hit=30
 Planning Time: 0.177 ms
 Execution Time: 3023.304 ms
(32 rows)

Time: 3107.421 ms (00:03.107)

Because we are only returning the top N rows, the memory used is not as high because a different sort methodology can be used. In addition, the time is further reduced.

As you can see with, a little tuning of the “work_mem” parameter, lots of performance can be gained in the system. In this example, we have increased “work_mem” a fairly small amount from 64kb to 64MB. In my mind you never want to increase “work_mem” to a setting where if all workers were being worked by CPU, you could overrun the free memory on the system. Also, remember that there is some overhead to maintaining that memory so it’s really important to find a good balance for your workload. Keep in mind that you can set this parameter at the server level, as an alter in the query text or at the user level as a profile.

Enjoy!

Three Configuration Parameters for PostgreSQL That Are Worth Further Investigation!

In my new role at Google, not only am I still working with lots of Oracle and replication tools, I am also expanding more into moving Oracle systems to Google Cloud on either CloudSQL for PostgreSQL or AlloyDB for PostgreSQL. After you have been looking at the systems for a little bit of time, there seem to be a few things worth tweaking from the out of the box values. It is my goal to discuss some of those things now and in future blog posts.

Let me start off by saying managed PostgreSQL CloudSQL products such as Google’s CloudSQL for PostgreSQL and AlloyDB for PostgreSQL (in Preview as of this post) are designed to be low maintenance and fit many different types of workloads. That being said, there are a few configuration parameters that you should really look at tuning as the defaults (as of PostgreSQL version 14) in most cases are just not set to the most efficient value if your workload is anything more than a VERY light workload.

work_mem

Sets the base maximum amount of memory to be used by a query operation (such as a sort or hash table) before writing to temporary disk files and the default value is four megabytes (4MB). People coming from the Oracle world will equate this setting with PGA, however you must keep in mind that the implementation is “private” memory in PostgreSQL while it is “shared” memory in Oracle. You must take care not to over configure this setting in PostgreSQL.

A full description of the parameter can be found here.

random_page_cost

Sets the planner’s estimate of the cost of a non-sequentially-fetched disk page and the default is 4.0. In reality this setting is good for a system in which disk performance is a concern (i.e a system with HDD vs SSDs) as it is assumed that random disk access is 40x slower than sequential access. Essentially if you want your system to prefer index and cache reads, lower this number from the default, but to no lower than the setting for seq_page_cost. For normal CloudSQL for PostgreSQL deployments that use SSD, I like to set this to 2. In deployments which utilize AlloyDB for PostgreSQL an even lower setting of 1.1 can be used due to the efficient Colossus Storage implementation.

For those that have been around Oracle for a while, this parameter behaves much like the “optimizer_index_cost_adj” parameter.

A full description of the parameter can be found here.

effective_io_concurrency

Sets the number of concurrent disk I/O operations that PostgreSQL expects can be executed simultaneously. Raising this value will increase the number of I/O operations that any individual PostgreSQL session attempts to initiate in parallel. The default is 1 and at this point this setting only effects bitmap heap scans. That being said, bitmap heap scans, while efficient, by nature have to look at the index as well as a corresponding heap block and if that data has to be read from disk and if your system can handle the parallelism like when you use SSD storage, you should increase this to a more meaningful value. I will do a separate blog post to show the effects of this, but in general as this number is increased beyond 1/2 the number of CPUs available, greater diminishing returns are observed.

A full description of the parameter can be found here.

In closing, just like Oracle and other RDBMSs, there are numerous configuration parameters all which can have effects on the workload. However, the above three parameters are the ones I most often find that have opportunities for optimization, especially on more modern platforms.

In future posts I will detail how each one of these can change a workload.

Enjoy!